# Welcome

Welcome to **TgMetrics**, the AI-powered analytics platform designed to empower Crypto communities and investors alike. Whether you're part of a thriving community or seeking your next investment opportunity, TgMetrics is built to give you the insights you need.

***

### If you are a community 🚀

As a community member or owner, you know that **engagement and visibility** are key to success. With the new **X Analytics** integrated into TgMetrics, your reach goes beyond Telegram — giving you full visibility across platforms.

TgMetrics helps you:

* **Track Engagement (Telegram & X):**\
  Monitor active members, daily tweet activity, sentiment trends, and overall engagement across both platforms — all in real-time.
* **Analyze Sentiment:**\
  Understand how your community is perceived with sentiment scores, polarity breakdowns, and trending mentions on X.
* **Optimize Activity:**\
  Use heatmaps and trend graphs to pinpoint the best moments to activate your community or schedule announcements.
* **Boost Your Reputation:**\
  Customize your profile with an **X handle**, **website**, and more — making your project more discoverable on TgMetrics and social media.
* **Amplify Your Impact:**\
  Leverage **Raidboard**, a powerful X integration that ranks your most active community raiders and boosts coordinated visibility.
* **Stay Informed Easily:**\
  Get daily **TL;DR summaries** of recent tweets, delivered by our bot — keeping everyone informed without scrolling endlessly.
* **Grow Smart:**\
  Use **cross-platform data** to understand what’s working, when to act, and how to improve participation and reach.
* **Showcase Your Strength:**\
  Highlight your most impactful tweets, smart followers, and growth momentum — all visible on your public profile.

***

### If you are an investor 💡&#x20;

As an investor, spotting high-potential projects backed by real, active communities is more important than ever. TgMetrics now gives you a **dual-lens view across Telegram and X**, helping you separate hype from substance.

TgMetrics helps you:

* **Evaluate Community Health (Telegram + X):**\
  Assess activity, engagement consistency, sentiment trends, and influencer attention — all in one place.
* **Transparency You Can Trust:**\
  Access clear and verifiable data on how communities perform publicly and whether their growth is real or inflated.
* **Discover Hidden Gems:**\
  Identify rising projects early by spotting breakout engagement, bullish sentiment, or strong support from smart followers.
* **Make Confident Decisions:**\
  Back your investments with **multi-platform insights** — understanding both the numbers and the narrative.

***

With TgMetrics, both communities and investors can thrive together. Whether you’re looking to grow or invest, we’re here to help you every step of the way.<br>


# About TgMetrics

### What is TgMetrics? <a href="#whats-repoanalyzer" id="whats-repoanalyzer"></a>

We know how important a strong community is behind a crypto project. There are countless examples where a united community was the key factor helping a project thrive and gain widespread attention.

But how can investors differentiate between fake engagement and genuinely active communities? And from a community perspective: how can you incentivize your members, grow organically, and attract more eyes to your project?

That's why we built **TgMetrics**, an AI-powered analytics platform designed to empower crypto communities and provide essential insights for crypto investors.

### Why TgMetrics? <a href="#whats-repoanalyzer" id="whats-repoanalyzer"></a>

In the crowded crypto landscape, identifying genuine community engagement from superficial activity is crucial. Built from the community, for the community, TgMetrics simplifies this by providing clear, reliable insights that empower communities to grow organically and help investors make confident, informed decisions.&#x20;

We are always listening to our users and continuously improving our product, dedicated to fostering transparency and authenticity so that both communities and investors can thrive together.

### How do I see the metrics? <a href="#whats-repoanalyzer" id="whats-repoanalyzer"></a>

If you're part of a community using TgMetrics, you can easily access key metrics, daily summaries, and more by directly using the bot commands. Additionally, major metrics are available on our website: [link](https://www.tgmetrics.ai/analysis/8tdzC7mFKhmfPg3KdSBafHqH7jgi3CvKomfj3Hhupump).

You can conveniently search by Telegram community name, X handle, or contract address.

* Check our own community dashboard here: [link](https://tgmetrics.ai/analysis/tgmetrics).
* And here is the bot to add to any community: [link](https://t.me/TgMetricsAiBot)

### Important Links <a href="#whats-repoanalyzer" id="whats-repoanalyzer"></a>

* X: [link](https://x.com/tgmetrics)
* Telegram: [link](https://t.me/TgMetrics_Portal)
* Telegram Bot: [link](https://t.me/TgMetricsAiBot)
* Website: [link](https://tgmetrics.ai/)


# Getting Started with TgMetrics

If you are an investor or a community owner, we've got your back! Here's how you can get started using TgMetrics.

### Community Owner :rocket:

* **Watch this video:** Get a quick overview of how to configure the bot in your community [here](https://x.com/tgmetrics/status/1882878851505848529?s=46\&t=UuSTVFYtNRWR3EEhgY_xbA).
* **Step 1:** Add the TgMetrics bot to your Telegram group by clicking [here](https://t.me/TgMetricsAiBot).
* **Step 2:** Customize your community profile with your X handle, website and contract address by calling `/config` command
* **Step 3:** Use bot commands to regularly track your engagement metrics and community health.
* **Step 4:** Visit our [website](https://tgmetrics.ai/) to view detailed analytics and compare your community with others.

### For Investors :bulb:

* **Step 1:** Go to our [website](https://tgmetrics.ai/)
* **Step 2:** Click on **Launch App** and search for a community by their X handle
* **Step 3:** Analyze community engagement, sentiment, and activity metrics to identify promising projects.

Start leveraging the power of TgMetrics today and make informed decisions for your community or investments!

Ready to try it? Start navigating our website, add or invite communities to integrate TgMetrics into their Telegram groups. **Your feedback is always welcome!**


# How Blippers Earn Points

Every Blips campaign distributes part of a project’s token supply to its early supporters — the **Blippers**. Your **Blips** determine how much of that reward pool you’ll receive.

The more value you bring to the project — through visibility, engagement, and authentic support — the more Blips you earn.

***

### How it works

Each campaign has a **reward pool** and a **timeline**.

During the campaign:

* You create and share **content** about the project.
* Tgmetrics analyzes your actionson X
* You accumulate **Blips** in real time.

At the end of the campaign:

* All points are ranked.
* Rewards are distributed proportionally to each Blipper’s total Blips.

***

### 🧩 What Kind of Content Earns Points – and How Relevance Matters

Blips rewards creators who add **real value**, not noise. The more relevant your content is — meaning: directly relevant to the campaign, insightful, and engaging — the higher your points. This means:

* Use your **own voice**, not mere reposts or generic statements.
* Educate your audience: explain *why* the project matters, *how* it works, or *what’s next*.
* Format for readability and impact: clear structure, visuals, spacing.
* Expand reach: aim to attract new eyeballs, not only your usual audience.

***

### 🧮 How Blips Are Calculated

Your Blips are derived from a scoring model that evaluates:

* **Relevance**: Is the content directly aligned with the campaign/project?
* **Quality**: Originality, clarity, depth, and design of your content.
* **Engagement**: Interaction your content generates (genuine replies, shares, new audiences).
* **Reach & Authenticity**: How many real people you reach; minimal bot/farm activity.
* **Consistency & Loyalty**: Supporting the same project over time gives a bonus multiplier.

#### Simplified Formula

```
Blips = (Relevance × Quality × Engagement × Reach) + (Consistency × Loyalty)
```

Where:

* **Relevance**: Score between 0 – 1 (how tightly aligned your content is with campaign topic)
* **Quality**: Score between 0 – 1 (originality, clarity, insight)
* **Engagement**: Weighted number of genuine interactions
* **Reach**: Real-user audience size, adjusted for authenticity
* **Consistency**: Number of days/weeks you’ve actively posted about the campaign
* **Loyalty**: Multiplier for staying with the same project rather than switching frequently

***

### 🧠 Example Scenarios

* You publish a high-quality thread about the project’s utility, include an infographic, get meaningful replies and reshares — **High Blips**.
* You post multiple short hype-tweets with little substance — **Low Blips** because relevance and quality are weak.
* You consistently post weekly updates and insights under the same campaign — **Blips boosted** via consistency + loyalty.
* You copy others’ content or repeat identical posts — **Possibly zero Blips**, or even penalised for low relevance/quality.

### 🔒 Anti-Spam & Fairness Rules

To protect the ecosystem and keep things fair:

* Low-effort or repetitive content may be ignored entirely.
* Reposts without added value or generic hype will score poorly.
* Engagement from bots/farms or inorganic amplification is filtered out.
* Jumping between many campaigns reduces your loyalty multiplier and score potential.

***

### 📈 Tips to Maximize Your Blips Points

* Choose a project you believe in — that allows you to produce **original and relevant content**.
* Produce **one great post** instead of many weak ones.
* Use **visuals or clear formatting** to make your content stand out.
* Tag the project to ensure tracking.
* Be consistent: post updates across campaign duration rather than a single burst.

***

### 🏁 End of Campaign – Reward Distribution

* At campaign close, all Blips are merged and ranked.
* Your share of the reward pool = (Your Blips) / (Sum of all Blippers’ Blips).
* Rewards (tokens, NFTs, bonuses) are distributed on-chain, transparently.

***

### 🧭 In Summary

| Step                                     | What You Do             |
| ---------------------------------------- | ----------------------- |
| 1️⃣ Craft insight-driven, relevant posts | Relevance × Quality     |
| 2️⃣ Engage authentically                 | Engagement              |
| 3️⃣ Expand reach and bring new eyes      | Reach                   |
| 4️⃣ Stay focused on a project over time  | Consistency × Loyalty   |
| 5️⃣ Avoid low-quality noise              | Prevent score penalties |

> *At TgMetrics, we reward creators who bring meaningful signal — not just volume. Produce, engage, repeat.*


# Holders Early Access

Blips Early Access is an exclusive opportunity for $TGMETRICS holders to join new project launches before everyone else.  It’s fair, transparent, and designed to reward real holders — not bots or clic

### &#x20;What Is Blips Early Access?

When a new project launches through **Blips**, a portion of its early access pool is reserved for **$TGMETRICS holders**.

Instead of rushing or paying gas wars, you simply **register your interest** — and the system fairly decides who gets early access through a **weighted shuffle**.

No one can front-run it.\
No one can buy their way in.\
Your **tier** defines your **chances**, not your speed.

***

### How it Works (Step by Step)

{% stepper %}
{% step %}

#### Register Your Interest

* Choose the campaign you want to join and tell us how much SOL you’d like to allocate.
* You **don’t send SOL yet** — this step is just to express interest.

{% hint style="info" %}
You can edit your amount anytime while registration is open.
{% endhint %}
{% endstep %}

{% step %}

#### Snapshot

A few hours before the campaign launch, Tgmetrics takes a **snapshot** of your wallet to verify your $TGMETRICS balance.

This ensures:

* Only holders at snapshot time qualify.
* Balances are validated securely.
* Everyone gets a fair shot based on their actual holdings.
  {% endstep %}

{% step %}

#### Weighted Shuffle (Fair Selection)

Once registration closes and snapshot is done, a **weighted shuffle** decides who gets in.

* Each tier gives you a certain number of **tickets** (see table below).
* More tickets = higher chance to be selected.
  {% endstep %}

{% step %}

#### Deposit Phase (For Selected Wallets)

If you’re selected, you’ll see an on-screen notice and receive instructions to **send SOL** within a set deadline.

* Only selected wallets can deposit.
* Your allocation can’t exceed your tier’s cap.
* If you’re not selected, you simply don’t send anything.

After deposit, your early access is confirmed, and tokens will follow the vesting schedule when the TGE happens.
{% endstep %}
{% endstepper %}

***

### Tiers and Chances

Your tier is automatically determined by how much **$TGMETRICS** you hold at the snapshot.

| Tier        | Holding  | Allocation Cap | Tickets |
| ----------- | -------- | -------------- | ------- |
| **Whale**   | 5M+      | 1.5 SOL        | 8 🎟️   |
| **Dolphin** | 2M–5M    | 1.0 SOL        | 4 🎟️   |
| **Fish**    | 1M–2M    | 0.5 SOL        | 2 🎟️   |
| **Shrimp**  | 0.25M–1M | 0.25 SOL       | 1 🎟️   |

{% hint style="info" %}
**More tickets** = better odds in the shuffle.\
**Caps are strict** — no one can deposit above their tier limit.
{% endhint %}

***

### Vesting Details

Every project may have a slightly different vesting schedule, but by default:

* **30% unlocks at TGE (Token Generation Event)**
* **Remaining 70%** is distributed **weekly**

The vesting details are always visible on the campaign page before you confirm your deposit.

As Blips campaigns usually involve **new launches with low market cap**, this vesting model was designed to **protect both you and the developers** — avoiding sudden dumps, ensuring healthy price growth, and giving the project time to build real traction.

***

### Video

We recorded a quick video showing how it works in practice

<https://x.com/tgmetrics/status/1984343178275676358>


# Early Access Deposit

### How Deposits Work

Once you’ve been **selected in the Early Access shuffle**, you’ll be invited to **confirm your allocation** by depositing SOL.

This is the final step to secure your spot in the campaign before the public launch.

***

### Step-by-Step Process

{% stepper %}
{% step %}

#### Connect your Wallet

Log in using the **wallet** you hold $TGMETRICS.

Once connected, you’ll see your tier and the **amount you can deposit** based on your tier. You can then inform how many SOLs you want to deposit.
{% endstep %}

{% step %}

#### Make the Deposit

You can deposit in two ways, depending on the campaign setup:

* **Automatic Deposit:**
  * The platform will prompt you to confirm a transaction directly from your wallet.
  * Simply approve it, the amount will be sent automatically.
* **Manual Deposit:**
  * You can choose to transfer manually the amount to the specified address.
  * So you don't need to confirm the transaction via Tgmetrics, but doing it manually instead.
    * **MAKE SURE YOU ARE TRANSFERRING TO THE CORRECT WALLET ADDRESS. WE ARE NOT RESPONSIBLE FOR ANY WRONG TRANSFER**
      {% endstep %}

{% step %}

#### Wait for Confirmation

Once your transaction is sent, the system will verify it automatically.

This can take a few moments depending on network congestion.\
Don’t worry — your **deposit status will update** on the campaign page as soon as it’s confirmed on-chain.
{% endstep %}
{% endstepper %}

***

### Deposit Window

Each campaign has a **defined deposit deadline**.\
Deposits after the deadline won’t be accepted, so make sure to act while the window is open.

***

### After Deposit

Once confirmed:

* Your **allocation is locked in** for the campaign.
* Your tokens will be distributed according to the **vesting schedule** shown on the campaign details [(e.g. 35% at TGE + weekly unlocks)](/blips/vesting-period-blippers-and-early-access).

***

### Key Notes

* Always use the **same wallet** for registration, snapshot, and deposit.
* Deposits are **non-refundable**, as they are used to secure your early allocation.
* The process is **fully transparent** — all transactions are verifiable on-chain.
* If you experience delays, simply refresh or revisit the campaign page; your status will sync automatically.


# Vesting Period (Blippers and Early Access)

Every Blips campaign includes a **vesting system** — a structured release of tokens over time.\
It’s not just a technical mechanism — it’s a **core principle of Blips** designed to protect **both the community and the developers**, ensuring stability, fairness, and sustainable growth.

***

### Why Vesting Exists

Crypto launches often suffer from short-term hype, sudden dumps, and unstable charts.\
We built Blips to do the opposite — to create **long-term alignment** between everyone involved:

* **For the community:** ensures your early support isn’t diluted by instant sellers.
* **For the developers:** gives teams room to build, grow, and deliver without constant sell pressure.
* **For the ecosystem:** maintains healthy, organic price discovery.

Blips vesting is the foundation that keeps the system **fair, transparent, and anti-pump-and-dump**.

***

### How Vesting Works

When tokens are distributed (either to **Blippers** or **Early Access depositors**), they are not released all at once.\
Instead, they follow a clear, **predefined schedule** that you can track directly on the campaign page.

#### **Standard Vesting Model**

* **35% unlocked at TGE (Token Generation Event)**\
  → Available immediately when the token goes live.
* **65% released weekly after TGE**\
  → Streamed automatically until your full allocation is unlocked (15% every week).

Each project may have its own variation, but the vesting structure always follows the same philosophy: **protect the long-term value**.

***

### Who Vesting Applies To

1. **Blippers (Supporters)**\
   If you earned tokens by supporting a campaign — posting, engaging, or spreading visibility —\
   your rewards follow the same vesting curve.\
   This ensures that **real contributors** benefit alongside the project’s growth, not short-term speculators.
2. **Early Access Depositors**\
   If you joined through **Blips Early Access**, your allocation also unlocks progressively.\
   This keeps early participants aligned with the project’s long-term health and prevents early dumping.

***

### Developer Lock - Mandatory

Every Blips campaign must follow one **non-negotiable rule**: **developer tokens must be locked for at least 3 months** after TGE.

This requirement guarantees:

* Builders stay fully aligned with their community.
* Projects can’t dump their own tokens after launch.
* The ecosystem remains transparent and trustworthy.

It’s a hard rule — no project can run a Blips campaign without committing to this minimum lock period.\
Developers can choose to lock longer, but **never shorter**.


# Project Launch - How It Works

Each Blips campaign goes live on a **launchpad chosen by the project’s developers**.\
While the Blips process — interest registration, shuffle, deposits, and vesting — is always the same,\
the **final step (token launch and buy execution)** depends on the **launchpad** where the token is released.

At Tgmetrics, we adapt our process to fit each platform’s structure — always focusing on:

* **Fair access for holders**
* **Protection against snipers**
* **Best possible market entry**
* **Full transparency**

Below you’ll find how this works today for **Pump.fun**, with other launchpads (like Bonk, Believe, and Z Combinator) being added soon.

***

### Launch Workflow (All Launchpads except Z Combinator)

Every Blips launch, regardless of the platform, follows the same high-level logic:

1. **Project launches token** → Dev tokens are locked immediately.
2. **Early Access deposits are executed** → SOL from the Early Access pool is used to acquire tokens.
3. **Tokens are distributed** → Each participant receives a share based on their contribution.
4. **Vesting begins** → Unlocks happen progressively (35% at TGE + weekly).

The way these steps happen in practice depends on how the **launchpad** works.


# Pump Fun Launches

### Overview

Pump.fun doesn’t have a **pre-TGE (Token Generation Event)** phase — when a token is launched, it goes **straight to the open market**.\
Because of this, Blips uses a **custom launch mechanism** built to protect Early Access depositors and secure the **best possible price** while respecting Pump.fun’s open and transparent model.

***

### Step-by-Step

{% stepper %}
{% step %}

#### Token Launch & Developer Lock

* The developer launches the token
* **Developer tokens are locked immediately** for a minimum of **3 months**, ensuring full alignment and preventing early dumps.
* Tgmetrics receives the **Contract Address (CA)** directly from the developer before it’s made public.

This allows us to act faster and protect the early access pool from snipers.
{% endstep %}

{% step %}

#### Early Access Buy Execution

As soon as the token goes live, Tgmetrics executes the **buy operation** using the total SOL deposited in the Early Access pool (e.g., 30 SOL).

* The buy happens **on the open market**, seconds after the token creation.
* The process is **automated**, minimizing delay and human error.
* The goal is always to get the **best entry price possible** while avoiding sniper bots and excessive slippage.

We don’t pre-buy or front-run — we execute in real time, following Pump.fun’s decentralized design, but with optimized precision.
{% endstep %}

{% step %}

### **Token Allocation**

Once the buy is complete, all purchased tokens are distributed **proportionally** among Early Access depositors.

**Example:**

* Total pool: **30 SOL**
* Total tokens acquired: **50,000,000**
* A depositor added **1 SOL**

They receive:

> **(1 / 30) × 50,000,000 = 1,666,667 tokens**

Every depositor gets the same token-per-SOL rate — **no one pays more or less**.
{% endstep %}

{% step %}

### **Vesting & Claim**

After the purchase:

* Tokens are assigned to each wallet according to vesting rules.
* Vesting begins immediately after the TGE:
  * **35% unlocked at TGE**
  * **65% released weekly (will be sent to the user's wallet)**

Read more [here](/blips/vesting-period-blippers-and-early-access) about the Vesting Period.

{% endstep %}
{% endstepper %}

***

### Built for Fairness and Safety

We know Pump.fun launches are fast and competitive — that’s why we designed this system to **protect you**, not expose you.

Here’s how we ensure that:

| Protection                  | Description                                                                                                   |
| --------------------------- | ------------------------------------------------------------------------------------------------------------- |
| **Private CA Access**       | Tgmetrics receives the CA before public release, giving us a short reaction window to execute before snipers. |
| **Automated Buy**           | Executed by system scripts for precision and speed — no manual timing.                                        |
| **Dev Tokens Locked**       | Minimum 3 months — mandatory for all Blips campaigns.                                                         |
| **Fair Share Distribution** | Every SOL in the pool gets the same rate of tokens.                                                           |
| **On-Chain Proof**          | All transactions and allocations are verifiable.                                                              |

***

### Other Launchpads

Each launchpad (Bonk, Believe, Z Combinator, etc.) has its own structure and requirements.\
We’re preparing detailed guides for each one — explaining how the Early Access and Blips systems adapt to them.

These guides will be available soon.


# How to add it

How to add TgMetrics to a Telegram Group;

The first step to start collecting Telegram Analytics and also to be visibile on our Website, is to add [**@TgMetricsAiBot**](https://t.me/TgMetricsAiBot) to your Telegram Group!

Here there is a video explaining step by step how to do it: [link](https://x.com/tgmetrics/status/1882878851505848529).

In case you are more a text person, here are the steps to follow:

### How to Configure TgMetrics in Your Community

{% stepper %}
{% step %}

#### Add @TgMetricsAiBot to your community

* Go to your Telegram Group settings and select "Add Members."
* Search for @TgMetricsAiBot and add it to the group.
  {% endstep %}

{% step %}

#### Start the Bot

* Type `/start` in your Telegram Group to activate and begin configuring the bot.
  {% endstep %}

{% step %}

#### Access Configuration Settings

* Type `/config` to open the configuration panel.
* You will see two options:
  * **Update Contract Address (CA)**
  * **Update Socials**
    {% endstep %}

{% step %}

#### Update Contract Address

* Click **Update Contract Address (CA)** and provide your contract address when prompted.
* Once sent, you will receive a success message confirming the update.
  {% endstep %}

{% step %}

#### Update Socials

* Click **Update Socials**, where you’ll have two options:
  * Update your **X handle**
  * Update your **website**
* We recommend updating both so your community can be easily found on [tgmetrics.ai](https://tgmetrics.ai).
  {% endstep %}

{% step %}

#### You are all set!

* Congratulations! Your bot is now live.
* Your community metrics will be available on the website within **30 seconds**.
  {% endstep %}
  {% endstepper %}


# Leaderboard

The **Leaderboard** highlights the most active and engaged members in a community. It allows community owners and members to track engagement and recognize top contributors in real time. It provides transparency and recognition for users contributing the most to discussions and community growth.

<figure><img src="https://4095258247-files.gitbook.io/~/files/v0/b/gitbook-x-prod.appspot.com/o/spaces%2FiITdDHgPNjRpDaXkBzTh%2Fuploads%2FaWoEB2z6ULzmDOJy8Z5p%2FLeaderboard.png?alt=media&amp;token=e76ea157-7d44-4d58-97d5-fb6749db5378" alt="" width="406"><figcaption><p>Leaderboard command</p></figcaption></figure>

### How the points are calculated?

We filter the content of each message to determine whether it is relevant or not. If a message is classified as relevant, we further analyze its type and assign a score accordingly.

For now, every message counts as **1 point**, but we are actively refining this system to ensure better accuracy and fairness. Expect changes soon as we continue improving the way engagement is measured!

The **Leaderboard** highlights the most active and engaged members in a community. It allows community owners and members to track engagement and recognize top contributors in real time. It provides transparency and recognition for users contributing the most to discussions and community growth.

### **How It Works**

* To access the leaderboard, use the command `/leaderboard` in your Telegram group. You'll instantly see the ranking of the most **active members for today**.
* Want to check the leaderboard for a specific date? Use `/leaderboard YYYY-MM-DD` (e.g., `/leaderboard 2025-02-21`).
* **Need an overview of a date range?** Use `/leaderboard YYYY-MM-DD YYYY-MM-DD` (e.g., `/leaderboard 2025-01-01 2025-01-20`) to see the total points accumulated over that period.
* The bot tracks and ranks members based on their activity.
* Community owners can use this data to reward engagement and foster a more vibrant group.
* To check the leaderboard, use the command: `/leaderboard`.

{% hint style="info" %}
Please note that the leaderboard is updated **every 15 minutes.**
{% endhint %}


# Raidboard

The **Raidboard** is designed to track and showcase community-driven engagement efforts outside the Telegram group, particularly on X (Twitter). It works similarly to the [Leaderboard](/tgmetrics-bot/markdown) in terms of how to use it and the available filters, but it focuses on tracking interactions on X rather than Telegram messages. It allows communities to measure engagement beyond Telegram and recognize members who actively promote the project.

<figure><img src="https://4095258247-files.gitbook.io/~/files/v0/b/gitbook-x-prod.appspot.com/o/spaces%2FiITdDHgPNjRpDaXkBzTh%2Fuploads%2Fn98BN9eY9AO6ewZU6IdR%2FRaidboard.png?alt=media&amp;token=132efd4e-c5e9-410b-bf8b-94f474021726" alt="" width="406"><figcaption><p>Today's raidboard</p></figcaption></figure>

### How it works

* The bot monitors users participating in X raids—likes, retweets, and mentions supporting the community.
* To access the Raidboard, use the command `/raidboard` in your Telegram group. You'll instantly see the ranking of top contributors for today.
* Want to check the Raidboard for a specific date? Use `/raidboard YYYY-MM-DD` (e.g., `/raidboard 2025-02-21`).
* Need an overview of a date range? Use `/raidboard YYYY-MM-DD YYYY-MM-DD` (e.g., `/raidboard 2025-01-01 2025-01-20`) to see the total points accumulated over that period.
* The Raidboard ranks members based on their contribution to these external activities.
* This feature helps community owners measure and incentivize outreach efforts beyond Telegram.
* To check the Raidboard, use the command: `/raidboard`.

### How Raidboard Points Are Calculated

To ensure fairness and accuracy, we assign points based on different types of engagement:

* **2 points** for comments on X (Twitter).
* **3 points** for retweets.

### Important :warning:

To ensure that the TgMetrics bot detects when a raid has started, always use the raid bot command alongside the X post. We understand that some bots can identify when an X post is sent in the chat and automatically trigger a raid. However, TgMetrics only processes posts that are used in conjunction with the raid command for these bots.

{% hint style="info" %}
Please note that the Raidboard can take up to **12 hours** to reflect new interactions.
{% endhint %}

We are continuously refining this scoring system to provide better engagement tracking and reward meaningful contributions effectively.


# Stats

The **Stats** feature provides a detailed overview of community activity, including total members, message volume, admin participation, and sentiment analysis. This allows community owners and members to track trends and engagement levels in real-time.

<figure><img src="https://4095258247-files.gitbook.io/~/files/v0/b/gitbook-x-prod.appspot.com/o/spaces%2FiITdDHgPNjRpDaXkBzTh%2Fuploads%2F914a3kCEHj7fC4KG2u8j%2FStats.png?alt=media&amp;token=9b43278c-5ae2-4f83-8e1f-69d7e90f51ca" alt="" width="406"><figcaption><p>Stats command</p></figcaption></figure>

### Sentiment Analysis

The **Sentiment Analysis** feature leverages NLP (Natural Language Processing) with adaptations specifically for the crypto world. Each message is analyzed and classified into one of three categories:

* **Neutral** – Messages that do not indicate a strong positive or negative sentiment.
* **Bullish** – Messages expressing optimism and confidence in the project.
* **Bearish** – Messages indicating skepticism or negativity about the project.

### **How is it calculated?**

* The bot processes and evaluates messages within the community.
* Each message is classified based on sentiment trends.
* The final sentiment score is calculated dynamically, considering the ratio of bullish to bearish messages.
* The score is presented on a scale of **1 to 10**, offering a clear representation of the overall community mood.

This feature helps community owners and investors understand sentiment trends over time, enabling more informed decisions about engagement strategies and project outlooks.

### How it works

* To access the Stats, use the command `/stats` in your Telegram group. This will generate a report of the latest community activity.
* The stats include:
  * **Group Overview:** Total members, number of admins, and moderators.
  * **Today's Activity:** Total messages sent, admin contributions, and owner interactions.
  * **Sentiment Analysis:** A score reflecting the community's overall mood based on analyzed messages.
  * **Yesterday's Activity:** A comparison to previous day trends.

{% hint style="info" %}
Please note that the stats are updated **every 15 minutes.**
{% endhint %}


# TLDR

The **TL;DR Summary** feature provides an automated, structured recap of the most relevant discussions within the community. Instead of scrolling through hundreds of messages, users can quickly grasp the key topics discussed during the day.

<figure><img src="https://4095258247-files.gitbook.io/~/files/v0/b/gitbook-x-prod.appspot.com/o/spaces%2FiITdDHgPNjRpDaXkBzTh%2Fuploads%2F8FDt0wRUhYnsQFJKyWYx%2FTLDR.png?alt=media&amp;token=93a4face-30b4-4fdc-aafa-0596a8d5c862" alt="" width="406"><figcaption></figcaption></figure>

### How it works

* To generate a summary, use the command `/tldr` in your Telegram group. The bot will analyze recent discussions and provide a structured summary.
* It first filters out irrelevant messages, focusing only on the most meaningful content.
* The bot then organizes the key points into clear categories:
  * **Topic/Theme:** A concise title summarizing the main subject discussed.
  * **Description/Decision:** A short explanation detailing the discussion and any key takeaways.
* Users can also filter summaries by date using `/tldr YYYY-MM-DD` to retrieve discussions from a specific day.

{% hint style="info" %}
This feature is currently in **beta**, and we are actively improving its accuracy and performance based on user feedback.
{% endhint %}


# New Follower Alert

The **Follower Notification** feature keeps your Telegram community in the loop every time your project’s X account gains a new follower. By automatically announcing new followers in the group, the bot helps drive visibility and celebrate community growth in real-time.

Instead of checking manually or missing key engagements, the group is instantly notified, boosting momentum and engagement within the community.

<figure><img src="https://4095258247-files.gitbook.io/~/files/v0/b/gitbook-x-prod.appspot.com/o/spaces%2FiITdDHgPNjRpDaXkBzTh%2Fuploads%2FD3IgtWXYKO9C4d8elvJC%2Fimage.png?alt=media&amp;token=d11d3f32-ddcf-4b2f-9e63-91fbb12a003e" alt=""><figcaption><p>New Follower Alert</p></figcaption></figure>

#### How to activate it

{% stepper %}
{% step %}

#### Access Configuration Settings

* Type `/config` to open the configuration panel.
* Update your socials, if you haven’t already.
  {% endstep %}

{% step %}

#### Enable tracking

* In the first part of Configuration settings, go to Follow Alerts
* Tap "Enable tracking" to have enable the follow alerts :white\_check\_mark:
* Set Min Followers if you want
  {% endstep %}

{% step %}

#### You are all set!

* You will start receiving new follower notifications respecting the Min Followers in a few minutes!
  {% endstep %}
  {% endstepper %}

#### How it works

* To activate this feature, follow the steps above
* Once set, every time a new account follows your X profile, the bot will post an alert in your Telegram group.
* The alert includes:
  * The handle of the new follower.
  * Their profile picture and follower count.
  * A clean visual that celebrates the follower joining your journey.

This is a great way to:

* Show community traction.
* Acknowledge new supporters publicly.
* Create social proof for investors and members.


# Dashboard

When clicking on "**Launch App**" in the homepage, you will be redirected to our Dashboard:

<figure><img src="https://4095258247-files.gitbook.io/~/files/v0/b/gitbook-x-prod.appspot.com/o/spaces%2FiITdDHgPNjRpDaXkBzTh%2Fuploads%2FxgmMMdmzp36Cu3wC1xWH%2Fimage.png?alt=media&amp;token=187af5ad-f739-473d-aa43-aad952cd340a" alt=""><figcaption><p>Dashboard</p></figcaption></figure>

The **Community Discovery** page allows users to explore the diverse ecosystem of communities who added **TgMetrics** to their Telegram groups, offering a gateway to real-time insights and featured content. It enables investors, analysts, and community managers to discover trending communities, analyze social presence, and engage with key metrics instantly.

This interface highlights top-performing communities, upcoming or past events, and direct links to dashboards, making it easy to monitor activity and identify emerging projects worth watching.

#### What's Displayed

* **Search by X Handle** – Allows users to search and locate any Telegram-linked project by entering its X (Twitter) handle. This is the entry point for accessing community dashboards.
* **Featured Community** – Highlights a specific community selected by the platform (e.g., based on recent events or performance). The section includes event replays and contextual info such as event timing and tags like "X Space."
* **A Taste of Our Communities** – A curated showcase of notable communities across Telegram and Twitter. Each tile displays:
  * Community name and logo
  * X handle and Telegram username
  * Follower/member counts for both platforms


# Plans

The **TgMetrics Plans** define your access level to premium features based on how many **$TGMETRICS tokens** you hold in your Solana wallet. Unlock sentiment analytics, smart follower breakdowns, and more by simply holding tokens and connecting your wallet.

#### How It Works

1. **Buy $TGMETRICS**
   * You can purchase $TGMETRICS on [Raydium](https://raydium.io/swap/?inputMint=sol\&outputMint=8tdzC7mFKhmfPg3KdSBafHqH7jgi3CvKomfj3Hhupump) or other Solana-based DEXs.
   * Make sure to use the [**official contract address**](/general/tokenomics) when buying.
2. **Connect Your Wallet**
   * Click the **“Connect Wallet”** button at the top of the page.
   * You’ll need a **Solana wallet** (e.g. Phantom or Solflare) with $TGMETRICS tokens inside.
   * Once connected, TgMetrics will automatically detect your balance and assign your tier.
3. **Check Your Tier**
   * After connecting, your current tier is displayed.
   * You can also click **“Re-check my tier”** at any time to refresh your access.

#### Tier Levels & Benefits

| Tier       | Token Requirement  | Sentiment Score | Smart Followers | Sentiment Analysis | Searches per Day |
| ---------- | ------------------ | --------------- | --------------- | ------------------ | ---------------- |
| **Basic**  | 0 $TGMETRICS       | ❌               | ❌               | ❌                  | 5                |
| **Tier 1** | 400,000 $TGMETRICS | ✅               | ✅               | ❌                  | 10               |
| **Tier 2** | 800,000 $TGMETRICS | ✅               | ✅               | ✅                  | Unlimited        |

#### FAQ Highlights

* **Where can I buy $TGMETRICS?**\
  On Raydium or other Solana-based DEXs. Always double-check the token address.
* **How often is my tier updated?**\
  Automatically when you connect your wallet. You can also refresh it manually.
* **Do I need to stake the tokens?**\
  No — just **holding** $TGMETRICS in your wallet is enough to unlock access.


# Overview

The **Community Dashboard** provides a comprehensive view of a community's key performance indicators (KPIs), offering real-time insights into engagement, sentiment, and activity trends. Users can filter data by specific date ranges, ensuring they can track growth and changes over time.

:tada: **NEW:** now you have access not only to Telegram group metrics but also X analytics, in a single dashboard!

<figure><img src="https://4095258247-files.gitbook.io/~/files/v0/b/gitbook-x-prod.appspot.com/o/spaces%2FiITdDHgPNjRpDaXkBzTh%2Fuploads%2FB5vvQ96eqxoTbvS248Bg%2Fimage.png?alt=media&amp;token=5cc015bf-22d3-45dc-9c4d-0d71141cd8b3" alt=""><figcaption><p>Overview community dashboard</p></figcaption></figure>

### What's Displayed

* **X Overview** – Number of followers, following, account age and profile picture
* **Main KPIs** – Metrics such as total members, active users, messages per day, and sentiment scores.
* **Date Filtering** – Users can adjust the date range to view trends over time.
* **Graphical Insights** – Visual charts present the evolution of community activity in an intuitive format.
* **Category Champions** – Highlights the most active members based on engagement type (e.g., text messages, documents).
* **Activity Heatmap** – A visual representation of when the community is most active throughout the week.
* **User Leaderboard** – A ranking of the top contributors based on engagement and interactions.
* **X Analytics** – Click to that tab to see analytics for the X page

This dashboard helps community managers and investors monitor growth, understand engagement patterns, and make data-driven decisions ef*ficientl*y

We will explain into more details each of the KPIs.


# Members Count

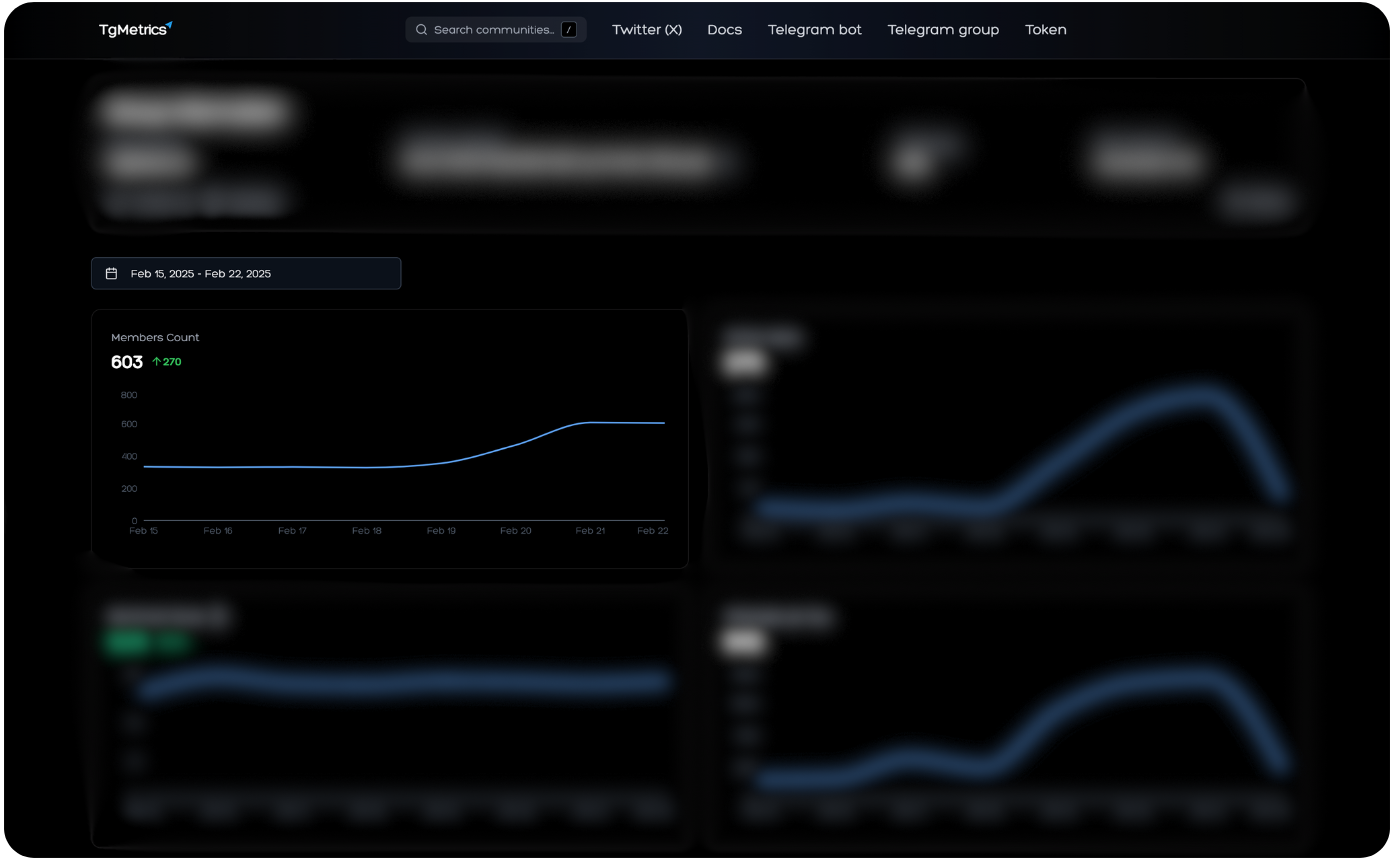
The **Members Count** section provides insights into the growth of a community over time. This graph tracks the total number of members and highlights trends in user acquisition.

<figure><img src="https://4095258247-files.gitbook.io/~/files/v0/b/gitbook-x-prod.appspot.com/o/spaces%2FiITdDHgPNjRpDaXkBzTh%2Fuploads%2FL1nduSMMqpzsfpiEFasY%2Fimage.png?alt=media&amp;token=b606c094-6012-4bb2-9b3b-ac65fcbfbb4d" alt=""><figcaption><p>Members count</p></figcaption></figure>

### How it works

* Displays the total number of members currently in the community.
* Shows the net increase or decrease in members over a selected time frame.
* The line chart visually represents the growth pattern, helping users analyze spikes or declines in community engagement.
* Users can adjust the date range to track member count evolution over specific periods.


# Active Users

The **Active Users** section tracks the number of community members who actively participate by sending at least one **message per day**. This metric helps assess engagement levels and community involvement over time.

<figure><img src="https://4095258247-files.gitbook.io/~/files/v0/b/gitbook-x-prod.appspot.com/o/spaces%2FiITdDHgPNjRpDaXkBzTh%2Fuploads%2FwQUPPRQvWymiPwP4CrA8%2Fimage.png?alt=media&amp;token=15e23245-7466-4398-b63f-872b8b761d38" alt=""><figcaption><p>Active Users</p></figcaption></figure>

### How It Works

* Displays the total number of active users within the selected time range.
* A line chart represents fluctuations in engagement, helping identify trends and peak activity periods.
* Users can adjust the date range to analyze engagement over different periods.
* Higher active user counts indicate strong community participation, while sudden drops may highlight inactivity or reduced engagement.


# Sentiment Score

The **Sentiment Score** section provides an AI-driven analysis of community discussions, offering insights into the overall mood and engagement within the group. By aggregating message sentiment, the system calculates a score ranging from 1 to 10, helping users assess the community’s atmosphere over time.

<figure><img src="https://4095258247-files.gitbook.io/~/files/v0/b/gitbook-x-prod.appspot.com/o/spaces%2FiITdDHgPNjRpDaXkBzTh%2Fuploads%2FIFyyql8I3Qs0ZYIgZgQo%2Fimage.png?alt=media&amp;token=dcfaa401-e67e-418f-998b-a90ed41e75f3" alt=""><figcaption><p>Sentiment Score</p></figcaption></figure>

### How It Works

* Each message is analyzed using sentiment classification, categorizing it as **bullish (positive), bearish (negative), or neutral**.
* The final score is computed based on the ratio of bullish to bearish messages, normalized to a 1-10 scale.
* A color-coded system helps interpret sentiment at a glance:
  * **7-10**: Great community sentiment (green)
  * **4-7**: Good community sentiment (yellow)
  * **Below 4**: Negative community sentiment (red)
* Users can filter the sentiment score by date, allowing them to analyze daily sentiment trends and track changes over time.
* A line graph visualizes sentiment fluctuations, helping identify patterns in community discussions.

This feature allows investors and community managers to gauge engagement quality and detect shifts in sentiment, making it easier to respond proactively to community needs


# Messages per Day

The **Messages per Day** section provides insights into the volume of messages sent within the community, reflecting overall engagement and activity levels.

<figure><img src="https://4095258247-files.gitbook.io/~/files/v0/b/gitbook-x-prod.appspot.com/o/spaces%2FiITdDHgPNjRpDaXkBzTh%2Fuploads%2F0y0zNu0CacJoFaZjkxGo%2Fimage.png?alt=media&amp;token=77a2d89b-d2e9-4255-b7e8-9d837859e144" alt=""><figcaption><p>Messages per Day</p></figcaption></figure>

### How it works

* Displays the total number of messages sent per day within the selected date range.
* A line graph shows trends in message volume, helping to identify spikes in activity or periods of lower engagement.
* Users can adjust the date filter to analyze message trends over time.
* High message counts often indicate strong engagement, while drops in activity may suggest lower participation.

This feature helps community managers and investors track engagement dynamics, assess the effectiveness of community interactions, and measure the impact of campaigns or announcement


# Message types

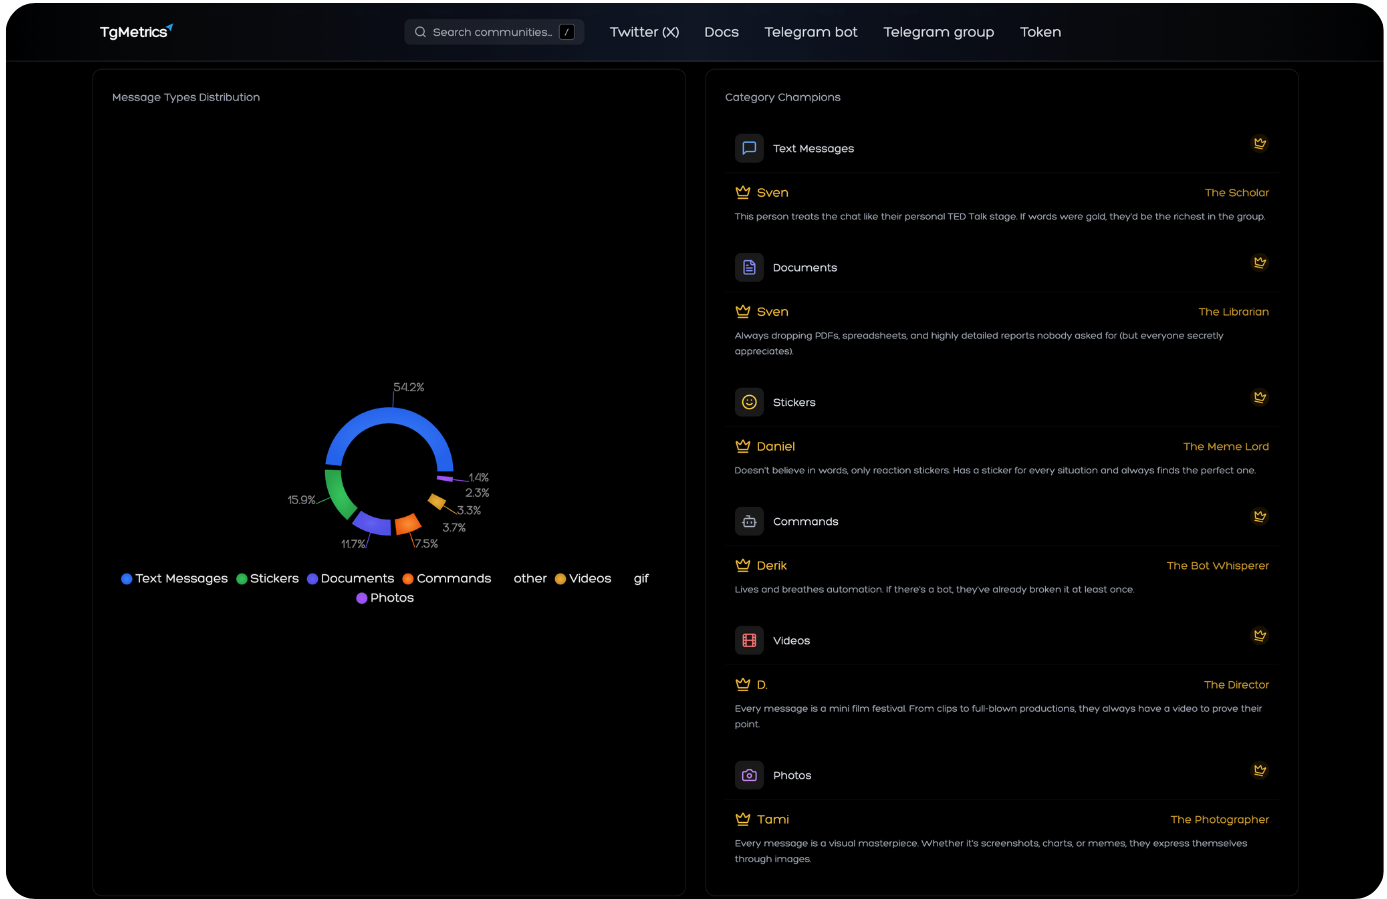
The **Message Types Distribution** section provides insights into the variety of content shared within the community, while the **Category Champions** highlights the most active members based on message types.

<figure><img src="https://4095258247-files.gitbook.io/~/files/v0/b/gitbook-x-prod.appspot.com/o/spaces%2FiITdDHgPNjRpDaXkBzTh%2Fuploads%2FCgzlMKSq8IHRbCJCutTY%2Fimage.png?alt=media&amp;token=57b7cc2c-2333-4e39-8861-c0262f1835f9" alt=""><figcaption><p>Message Types Distrubtion &#x26; Category Champions</p></figcaption></figure>

### How It Works

* **Message Types Distribution:**
  * A pie chart visually represents the proportion of different message types, such as:
    * **Text Messages** (blue) – Standard conversations and discussions.
    * **Stickers** (green) – Expressive reactions shared by members.
    * **Documents** (purple) – PDFs, spreadsheets, and other shared files.
    * **Commands** (orange) – Messages sent using bot commands.
    * **Photos, Videos, GIFs** – Multimedia content shared within the community.
  * This breakdown helps in understanding how members interact and communicate.
* **Category Champions:**
  * Recognizes the top contributors in different content categories, assigning unique titles:
    * **The Scholar** – Most text messages sent.
    * **The Librarian** – Most documents shared.
    * **The Meme Lord** – Most stickers sent.
    * **The Bot Whisperer** – Most bot commands used.
    * **The Director** – Most videos shared.
    * **The Photographer** – Most photos shared.
  * These titles provide a fun and engaging way to recognize community participation.

This section offers valuable insights into how the community communicates, helping managers encourage meaningful engagement and reward active members


# Activity Heatmap

The **Activity Heatmap** visually represents when a community is most active throughout the week, allowing users to identify peak engagement periods.

<figure><img src="https://4095258247-files.gitbook.io/~/files/v0/b/gitbook-x-prod.appspot.com/o/spaces%2FiITdDHgPNjRpDaXkBzTh%2Fuploads%2Fpl9XKcEQ8daLIDFfmj2w%2Fimage.png?alt=media&amp;token=20dcc9ec-92e3-4946-a0f8-d1d13e0ebb4f" alt=""><figcaption></figcaption></figure>

### How It Works

* The heatmap displays activity levels across different days and hours of the week.
* Each cell represents a time slot, with **darker colors indicating lower activity** and **lighter colors representing higher engagement**.
* The color-coded scale helps users quickly identify the busiest times within the community:
  * **0-13**: Low activity
  * **13-26**: Moderate activity
  * **26-39**: High activity
  * **39-52**: Peak activity
* This feature helps community managers and investors determine optimal times for announcements, discussions, or marketing efforts.

By analyzing the heatmap, users can better understand when the community is most engaged and adjust their interaction strategies accordingly.


# Leaderboard

The **User Leaderboard** ranks the top contributors in the community based on their engagement and activity levels. It provides a competitive and motivational aspect to encourage participation.

<figure><img src="https://4095258247-files.gitbook.io/~/files/v0/b/gitbook-x-prod.appspot.com/o/spaces%2FiITdDHgPNjRpDaXkBzTh%2Fuploads%2FxOtsvbxTYPYps5MxTSCb%2Fimage.png?alt=media&amp;token=0031aecb-86f9-44d3-a8d5-a3c0bcf489cd" alt=""><figcaption><p>User Leaderboard</p></figcaption></figure>

### How It Works

* Displays the **top 10** most engaged users in the community.
* Each user is ranked based on their accumulated **points**.
* The leaderboard includes key details for each user:
  * **Name** – The display name of the ranked member.
  * **Role** – Indicates whether the user is a member, moderator, or admin.
  * **Points** – A score reflecting the user's engagement level.
  * **Active Since** – The date when the user became active in the community.
* Users can track their ranking over time to see how their engagement compares to others.

The points are calculated based on different types of interactions within the community.

{% hint style="info" %}
Click [here](/tgmetrics-bot/markdown#how-the-points-are-calculated) for more details on how the scoring system works.
{% endhint %}

This feature helps foster engagement, recognize active contributors, and gamify community participation.


# AI Summary

By clicking on **"Generate AI Summary"** you get a quick, AI-powered summary of the most recent tweets from your community. The **AI Summary** scans the latest activity and condenses it into a short, easy-to-digest TL;DR — saving you time while keeping you informed on key topics, trends, and sentiment shifts.

<figure><img src="https://4095258247-files.gitbook.io/~/files/v0/b/gitbook-x-prod.appspot.com/o/spaces%2FiITdDHgPNjRpDaXkBzTh%2Fuploads%2Fc13byurbWsPFPBRDWTnJ%2Fimage.png?alt=media&amp;token=00d28cbe-4e8a-4ca1-9a19-27e638ec0532" alt=""><figcaption><p>AI-Generated Summary</p></figcaption></figure>

The top right displays the date range used for tweet filtering, while the bottom shows the number of tweets analyzed for the TL;DR.


# Sentiment Score

The **Sentiment Score** section provides a day-by-day measurement of the overall tone of recent tweets related to the community. It reflects how positively or negatively the project is being discussed on **X**, helping to identify mood shifts, potential volatility, and market sentiment in real time.

This is one of the two dedicated components for **sentiment monitoring** within the **X Analytics** view.

<figure><img src="https://4095258247-files.gitbook.io/~/files/v0/b/gitbook-x-prod.appspot.com/o/spaces%2FiITdDHgPNjRpDaXkBzTh%2Fuploads%2F3CsteqLwAsSHXxh9vQ2M%2Fsentiment_1.png?alt=media&amp;token=a17bc03c-490a-41ec-8d63-1eca8a8b20dd" alt=""><figcaption><p>Sentiment score by day</p></figcaption></figure>

#### How It Works

* **Displays the average sentiment value** for each day, based on recent tweets, and replies mentioning the proejct.
* The score ranges from **0 to 100**, where higher values represent more positive sentiment.
* The line chart allows users to **track sentiment fluctuations** and detect trend reversals or sudden spikes in positivity or negativity.
* You can **toggle between 3D and 7D views** to compare short-term and weekly sentiment patterns.
* A **total sentiment value** is shown below the chart, representing the cumulative trend direction for the selected period.

***

<figure><img src="https://4095258247-files.gitbook.io/~/files/v0/b/gitbook-x-prod.appspot.com/o/spaces%2FiITdDHgPNjRpDaXkBzTh%2Fuploads%2Fpgb6Ras3DyrXuXvjN2b1%2Fsentiment_2.png?alt=media&amp;token=25465f61-bd46-4687-8a6e-294ad7c1d849" alt=""><figcaption><p>Overall Sentiment Score</p></figcaption></figure>

In thi section you have more details about the current sentiment about the community, with details about what is the % of positive, neutral and negative

#### How It Works

* **Displays a score from 0 to 100**, where higher values represent more positive sentiment.
* A **qualitative label** (e.g. *Slightly Bullish*, *Neutral*, *Bearish*) helps interpret the numerical score at a glance.
* Below the score, you’ll find a **polarity distribution** showing the percentage of:
  * **Positive** tweets (green)
  * **Neutral** tweets (blue)
  * **Negative** tweets (red)
* Sentiment is calculated using natural language processing (NLP) models that analyze tweet content and classify tone.


# Mentions

The **Mentions** section highlights how frequently the project is being discussed on **X**, and by whom. It combines a time-based view of **mention volume** with a curated list of the **most impactful tweets** — helping users assess exposure, virality, and influencer activity.

<figure><img src="https://4095258247-files.gitbook.io/~/files/v0/b/gitbook-x-prod.appspot.com/o/spaces%2FiITdDHgPNjRpDaXkBzTh%2Fuploads%2FCiBOwuqeKdtgUGqbd5ak%2Fmentions.png?alt=media&amp;token=c43ddc31-ff8b-40e7-b3d1-28080d67dcfd" alt=""><figcaption><p>Mentions Graph &#x26; Top Mentions</p></figcaption></figure>

#### How It Works

* **Mentions Chart (right)**
  * Displays the **number of daily mentions** of the project over a selected time frame.
  * Helps track spikes in visibility, campaign impact, or sudden drops in attention.
  * Each data point corresponds to how many tweets included the community name, handle, or token tag.
* **Top Mentions List (bottom)**
  * Highlights tweets with the **highest number of views** that mentioned the project.
  * Each entry includes:
    * **User profile & handle**
    * **Tweet preview**
    * **Date of publication**
    * **View count**
    * **Number of likes**
  * Offers quick insight into **which influencers or viral posts** are driving attention.

***

This section is ideal for:

* Spotting **momentum shifts** in awareness or buzz.
* Identifying **top supporters, influencers**, or critics.
* Validating **campaign results** or the effectiveness of organic outreach.
* Surfacing tweets that may require community amplification or response.

***

Together, the mentions chart and top post feed provide both **quantitative reach** and **qualitative impact**, giving you a full picture of how your project is being talked about on X.


# Smart Followers

The **Smart Followers** section highlights influential  X users who are following and engaged at least once with the project.

<figure><img src="https://4095258247-files.gitbook.io/~/files/v0/b/gitbook-x-prod.appspot.com/o/spaces%2FiITdDHgPNjRpDaXkBzTh%2Fuploads%2FDyDXEmPuHAQi1QWa15Uf%2Fsmart_Followers.png?alt=media&amp;token=544108df-6926-4be9-9ec1-004966567ee3" alt=""><figcaption><p>Smart Followers</p></figcaption></figure>

#### How It Works

* Displays a curated list of **top influential profiles** that follow or interact with your project.
* Each entry includes:
  * **Username and handle**
  * **Follower count** (to assess their potential reach)
  * **Profile picture**


# Social Influence & Reach

This section is dedicated to identify how influent is this project.

<figure><img src="https://4095258247-files.gitbook.io/~/files/v0/b/gitbook-x-prod.appspot.com/o/spaces%2FiITdDHgPNjRpDaXkBzTh%2Fuploads%2FhBMt9VXC7qMxs245Rcpc%2Fsocial_influence.png?alt=media&amp;token=09492d00-5f97-41f1-85ca-df831231706a" alt=""><figcaption><p>Influence Ratio</p></figcaption></figure>

For now, this section has this KPI: **Influence Ratio:** a ratio between followers and following (higher is better). Calculated as **followers divided by following count.**


# Engagement Insights

The **Engagement Insights** section offers a deep dive into how consistently and actively the content is being engaged with on **X**. It combines trend analysis with engagement behavior metrics to help you understand visibility, volatility, and content performance over time.

<figure><img src="https://4095258247-files.gitbook.io/~/files/v0/b/gitbook-x-prod.appspot.com/o/spaces%2FiITdDHgPNjRpDaXkBzTh%2Fuploads%2FhvuwHE5ECTGAqICMBIox%2Fengagement_insights.png?alt=media&amp;token=2f8b0bd6-56cd-4368-9af2-8f1815b1aee1" alt=""><figcaption><p>Engagement Insights</p></figcaption></figure>

#### How It Works

**Engagement Consistency**

* Measures how stable the tweet engagement is over time.
* A **lower value** means your posts typically receive a **consistent number of interactions**.
* A **higher value** indicates the tweets experience **volatile spikes and dips** in engagement.
* Shows:
  * **Typical engagement value**
  * **Spread** (variance across days)

**Engagement Trend**

* Shows whether engagement is **increasing or decreasing** on average over time.
* The line graph plots engagement volume per day.
* A numeric indicator (e.g. `↓ 0.33/day`) reflects the **daily trend direction**.
* Helpful for spotting **momentum** or **loss of interest**.

***

#### Additional Metrics

* **Tweet Frequency** – Average number of tweets posted per day.
* **Engagement Rate** – Ratio of engagement to total tweets.
* **Days Analyzed** – Timeframe used to calculate metrics.
* **Total Engagement** – Cumulative number of interactions received during the analysis period.

***

These insights are designed to help you:

* Understand whether your content strategy is **stable or erratic**
* Detect engagement **trends** before they reflect in sentiment or market performance
* Benchmark **campaign impact** or influencer collaboration performance


# Growth & Momentum

The **Growth & Momentum** section visualizes the volume and consistency of a community’s tweeting activity over time. It tracks how often the account posts, how sustained that activity is, and highlights peak periods — offering a snapshot of how much energy and push is going into building social presence on **X.**

<figure><img src="https://4095258247-files.gitbook.io/~/files/v0/b/gitbook-x-prod.appspot.com/o/spaces%2FiITdDHgPNjRpDaXkBzTh%2Fuploads%2FYtJY5A5WpRUfvGC428ir%2Fgrowth.png?alt=media&amp;token=b3bb9ffe-b6b6-4439-8ffd-b7e0e1895f4b" alt=""><figcaption><p>Growth &#x26; Momentum</p></figcaption></figure>

#### How It Works

**Tweet Activity Graph**

* Shows the **number of tweets per day** over the selected period.
* Peaks and gaps help highlight **content push cycles**, active campaigns, or posting lulls.
* The top-right shows the **average number of tweets per day**.

**Key Activity Stats**

* **Total Tweets** – Number of tweets made during the selected timeframe.
* **Active Days** – Number of days with at least one tweet.
* **Average Tweets/Day** – Overall average tweet frequency.
* **Most Active Day** – The date with the highest tweet count, including how many tweets were posted that day.

***

This section helps you:

* Measure **output consistency** and spot **burnout or spikes** in posting.
* Track if tweet volume aligns with **engagement or sentiment trends**.
* Benchmark social activity against other communities or past periods.


# Hashtag Analysis

The **Hashtag Analysis** section breaks down how hashtags are being used in the tweets — helping to evaluate visibility strategies, branding consistency, and the reach of your messaging. It also highlights your top-performing tags to guide future content.

<figure><img src="https://4095258247-files.gitbook.io/~/files/v0/b/gitbook-x-prod.appspot.com/o/spaces%2FiITdDHgPNjRpDaXkBzTh%2Fuploads%2FkFK5gZTg16UfZEdV3d8r%2Fhashtag_analysis.png?alt=media&amp;token=6bf4d48e-a35b-4270-9a40-9bbecd3cfbf4" alt=""><figcaption><p>Hashtag Analysis</p></figcaption></figure>

#### How It Works

* **Tweets with Hashtags** – Percentage of total tweets that include at least one hashtag. A strong indicator of **discoverability strategy**.
* **Avg Hashtags/Tweet** – Measures how many hashtags are used on average in each post.
* **Unique Hashtags** – Total number of **distinct hashtags** used during the selected period.
* **Top Hashtags List** – Displays the most used hashtags, ordered by frequency (e.g. `#tgmetrics – 24x`), making it easy to spot branded or community trends.

***

This section helps you:

* Optimize content for **searchability and virality**.
* Detect **which narratives or campaigns** are being reinforced through hashtags.
* Avoid spammy behavior by keeping usage balanced and intentional.


# Top Posts

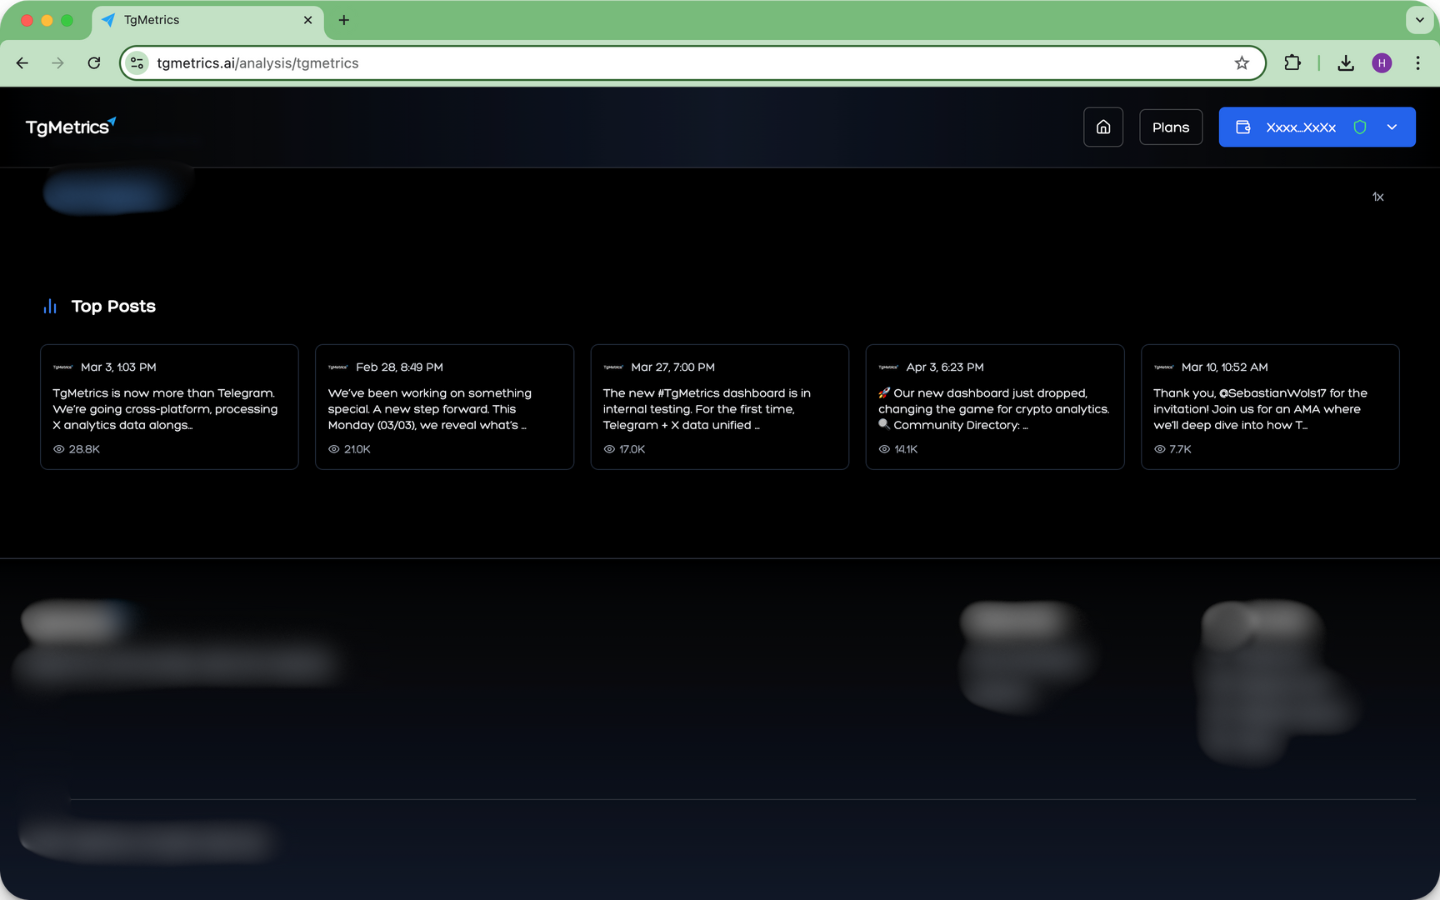
The **Top Posts** section showcases your most impactful tweets based on **view count**, helping you identify what content resonates most with the audience. Whether it's a product launch, update, or community event, this section lets you quickly surface what drove the most visibility.

<figure><img src="https://4095258247-files.gitbook.io/~/files/v0/b/gitbook-x-prod.appspot.com/o/spaces%2FiITdDHgPNjRpDaXkBzTh%2Fuploads%2FiXvmXcguKUUvC78rFzn1%2Ftop_posts.png?alt=media&amp;token=29b70087-9f96-4f85-89e9-616b2b3f3da7" alt=""><figcaption><p>Top posts</p></figcaption></figure>

#### How It Works

* Displays the **top-performing tweets**, ranked by **number of impressions (views)**.
* Each card includes:
  * **Date and time** the tweet was posted
  * A **preview of the tweet content**
  * **View count** (bottom left corner)

***

This section helps you:

* Understand **what type of content works** best for reach.
* Replicate formats, timing, or themes that drive **strong performance**.
* Monitor how **announcements, updates, or campaigns** perform relative to each other.
* Align content strategy with what actually captures attention.


# Tokenomics

### Token Overview

| Name              | Information                                    |
| ----------------- | ---------------------------------------------- |
| **Token Symbol**  | $BLIPS                                         |
| **Token Name**    | Blips                                          |
| **Token Address** | `6qqiEkw2vz4xoaFehAtrkF7mtxfT7m8BS2gSrvMrBLPS` |

### Supply Metrics

| Name               | Information         |
| ------------------ | ------------------- |
| **Total Supply**   | 1,000,000,000 Blips |
| **Current Supply** | 997,660,374 Blips   |


# Roadmap

At TgMetrics, we are on a mission to become the **must-have AI-driven social analytics hub** for all crypto projects and investors. This roadmap showcases our progress, from completed milestones to upcoming innovations.

<figure><img src="https://4095258247-files.gitbook.io/~/files/v0/b/gitbook-x-prod.appspot.com/o/spaces%2FiITdDHgPNjRpDaXkBzTh%2Fuploads%2Fs6FKZ3JYuMjMtndhTWeH%2FMoon%20Shot.png?alt=media&amp;token=009cf85b-85ea-4ae6-92ac-cfd7b7f7f411" alt=""><figcaption><p>Our Moon Shot</p></figcaption></figure>

Below, you’ll find our structured phases, including AI-powered enhancements, integrations, partnerships, and token utility expansions. Join us on this journey as we build the future of **crypto community intelligence**.

### Detail by phases

#### <mark style="background-color:green;">Phase 1: TgMetrics bot MVP (Done)</mark>

* Develop TgMetrics bot
* Develop TgMetrics API
* Develop TgMetrics Website
* Add to 5 communities for a test period
* Collect feedback and adapt the proejects

#### <mark style="background-color:green;">Phase 2: Token Launch (Done)</mark>

* Publish Docs
* Deployed Token on Pump.fun
* Configure social channels
* Locked tokens

#### <mark style="background-color:green;">Phase 3: Bot/Website enrichment and AI (Done)</mark>

* Add new KPIs to help the community with their analysis (Heatmap, message distribution)
* Integrate AI features for sentiment analysis on the bot and website
* Add TL;DR (AI summary) for group messages

#### <mark style="background-color:yellow;">Phase 4: X Integration (In progress)</mark>

* Create the structure for X integrations <mark style="background-color:green;">(Done)</mark>
* Release Raidboard <mark style="background-color:green;">(Done)</mark>
* Create the X analytics dashboard
* Allow users to see any X page, even if they are not using TgMetrics in their telegram group

#### Phase 5: Community Ranking

* Combine X and Telegram analytics to create the new TgMetrics score
* Release  the community ranking on the website

#### Phase 6: Token Holder Benefits

* Release the token holder benefits plan
* Restrict access to X/Telegram analytics for non-token holders
* Allow token holders to access more analytics and have higher usage limits for the service

***

### Marketing Actions

1. **Livestream about the product** (**Done**) – [link](https://x.com/tgmetrics/status/1889063555623977236)
2. **Published on CoinGecko** (**Done**) – [link](https://www.coingecko.com/en/coins/tgmetrics)
3. **Release marketing video about the X Integration** (Upcoming)
4. **New brand launch** (Upcoming)
5. **Livestream about the X Integration** (Upcoming)
6. **Expand CEX listings** (Upcoming)

***

### Partnerships

We are currently working on partnerships that remain confidential for now. However, we will soon be adding a list of partners along with their release dates on this page. Stay tuned!


# Important Links

Here is the list of all official links from **Blips**. Always ensure you are accessing the correct platforms to avoid scams or impersonators.

* Twitter (X): [link](https://x.com/blipsdotrun)
* Telegram: [link](https://t.me/blips_portal)
* Telegram Bot: [link](https://t.me/TgMetricsAiBot)
* Website: [link](https://blips.run/)
* Coingecko: [link](https://www.coingecko.com/en/coins/tgmetrics)
* Dex Screener: [link](https://dexscreener.com/solana/gpu2a7nywfoqgkct5yxmgmsdvu86lrhgbsfsg3gt5cbp)

### Stay Safe

* Only trust links shared on our official website and social channels.
* Be cautious of unsolicited messages or fake profiles pretending to be part of Blips.
* Blips will never ask for private keys, passwords, or sensitive information.

Always verify before engaging to keep your community experience secure


# Team

Tgmetrics is built by a small, highly focused team with deep experience in Web3, product design, engineering, and business development.<br>

We prioritize execution, transparency, and long-term thinking over hype.

Our team is constantly growing as the project evolves. Below is our current structure:

| Name             | Position                     | X                               |
| ---------------- | ---------------------------- | ------------------------------- |
| Louis \| Litt Up | Founder                      | <https://x.com/littupdev>       |
| The BG Hero      | Head of Business Development | <https://x.com/DBuildingGroup>  |
| Felipe Mendes    | Product Designer             | <https://x.com/felipemendesxyz> |
| PTR              | Frontend Engineer            | N/A                             |
| Sven             | Community Admin              | <https://x.com/GorillaDegen1>   |
| Tami             | Community Moderator          | <https://x.com/tamidrie>        |
| Leon Marvis      | Community Moderator          | <https://x.com/LeonMavis3141>   |

***

#### Join Us

We’re always open to connecting with strong builder and operators who believe in InfoFi, reputation-driven systems, and building for the long term.

If you’re interested in joining our mission, send an email to **<hello@tgmetrics.ai>** and tell us why you’d be a great fit.


# Introduction

The **Tgmetrics Business API** provides direct access to the most advanced dataset in the space when it comes to community behavior. From Telegram to X, our AI-driven engine captures, processes, and scores millions of signals to help you understand, compare, and act on what truly drives crypto projects.

Whether you’re building dashboards, powering research, or integrating engagement intelligence into your product, the Tgmetrics API gives you the data edge.

#### What Makes It Unique

* **Multi-Platform Coverage:** Telegram + X (Twitter) signals unified into one structured view.
* **Engagement Intelligence:** Member activity, retention indicators, and real-time message stats.
* **Sentiment Analysis:** AI-powered sentiment scores with volume-weighted confidence levels.
* **Community Scoring Engine:** Our proprietary scoring system ranks communities based on behavior, not hype.
* **Real-Time Data Access:** Fresh data piped in continuously, so you’re never looking at yesterday’s trends.

#### Designed for Builders, Investors, and Analysts

From ecosystem dashboards to internal tools, hedge funds to launchpads, the Business API was made to scale with your ambition. No scraping. No guesswork. Just clean, actionable data from the source.


# Plans

We designed our pricing to reflect the real value of community intelligence, while making it accessible for builders at every stage. Each plan unlocks full access to our Business API, including sentiment, scores, engagement metrics, and cross-platform data.

### Current Promotional Pricing

While in early access, all plans are available at a **discounted rate**:

| Monthly Requests       | Standard Price   | Early Access Price  |
| ---------------------- | ---------------- | ------------------- |
| Up to 10,000 requests  | ~~1 SOL / moth~~ | **0.6 SOL / month** |
| Up to 50,000 requests  | ~~2 SOL / moth~~ | **1.4 SOL / month** |
| Up to 100,000 requests | ~~4 SOL / moth~~ | **2 SOL / month**   |
| 100,000+ requests      | -                | **Contact us**      |

### All Plans Include

Access to all available data for projects listed on tgmetrics.ai, updated in constantly and enriched with our proprietary scoring models.

* Access to Telegram + X engagement data
* Real-time community metrics
* Sentiment and behavior scoring
* Priority support during beta

For usage beyond 100k requests/month or custom enterprise needs, reach [out to us](https://t.me/tgmetrics_portal), we’ll tailor a solution to fit your scale.